Regression is a type of supervised learning in machine learning that aims to predict continuous numerical values based on input data. It involves finding the relationship between input features and output value, which is typically represented as a straight line or curve that best fits the data. Regression models are commonly used in a variety of fields, such as finance, economics, and engineering, to make predictions on future trends or events. We can apply regression analysis to predict stock prices, company revenue and wind speed, as long as there are suitable features correlated to the targeted variable. The goal of regression is to minimize the difference between the predicted values and actual values, which is typically measured using a loss function such as mean squared error.
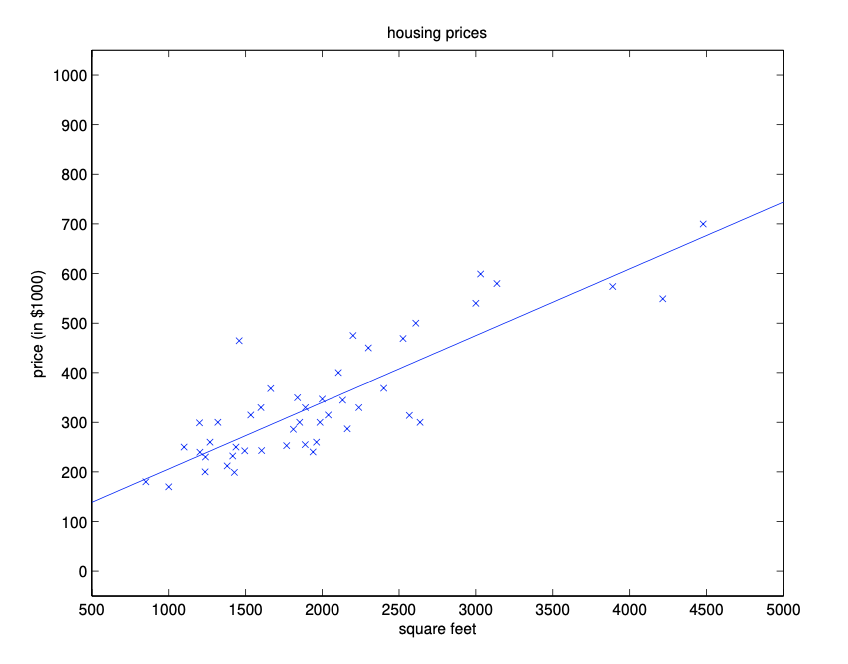
The simplest yet still very powerful models in regression is linear regression, meaning that its prediction is based on the linear combination of input features. For example, let’s consider a simple toy example of predicting the price of a house based on its size (\(s\)). The intuition is that a house of larger size is likely to be more expensive. The linear model has two parameters: a weight (\(w\)) for house size and an intercept term (\(b\)), which can be represented as a straight line in 2D space, as is shown in the following figure.
\[y = w \cdot s + b\]
In fact, house prices can depend on multiple factors rather than only size. We should make use of more informative features to improve predicion accuracy. Let’s add another feature to our linear model: the number of bedrooms (\(r\)). Then the linear model will look at the weighted sum of these two features (\(s\) and \(r\)), and outputs a predicted price:
\[ y = w_1 \cdot s + w_2 \cdot r + b\]
Here, \(w_1\) and \(w_2\) are the weights or coefficients associated with each feature, and \(b\) is an intercept term. The goal of linear regression is to learn these parameters from the training data, which contains many examples of houses with their corresponding sizes, number of bedrooms, and prices. The machine learning algorithm aims to tune or fit these parameters to minimize the difference between the predicted prices and the actual prices in the training set. After training, the model can be used to make predictions on new data.
We have seen the technique of augmenting space in unit2. Similarly, we often let \(w_0 = b\) in linear regression:
\[ y = w_1 \cdot s + w_2 \cdot r + w_0 \cdot 1\]
which can be simplified using dot product:
\[ y = (w_0, w_1, w_2) \cdot (1, s, r)\]
Here we expressed the linear combination as a dot-product between the weight vector \(\mathbf{w}=(w_0, w_1, w_2)\) and the feature vector \(\mathbf{x}=(x_0, x_1, x_2) = (1, s, r)\). Note that each house will always have the first feature being the constant \(x_0=1\) so that we can express the bias term \(b\) as part of the weight vector (\(w_0\)).
More generally, each input object is mapped to a feature vector \((x_1, x_2, \ldots, x_d)\) in a \(d\)-dimensional space, and we always add one more dimension (the bias dimension) up front so that we have \(d+1\) dimensions:
\[ \mathbf{x} = (x_0, x_1, x_2, \ldots, x_d)\]
where \(x_0=1\) for all inputs. This \(d+1\) dimensional space is called the augmented space. The weight vector \(\mathbf{w}\) is similarly augmented to include the extra bias term \(w_0=b\).
\[ \mathbf{w} = (w_0, w_1, w_2, \ldots, w_d)\]
The output of a linear regression model will now be based on the dot product \(\mathbf{w} \cdot \mathbf{x}\) in the augmented space, i.e.,
\[ \hat{y} = \mathbf{w} \cdot \mathbf{x}\]
where \(\hat{y}\) indicate that it is a predicted value.